
Page 12 - SafeLinkEvaluation
P. 12
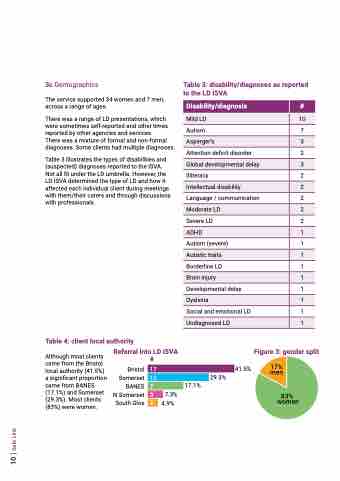
3c Demographics
The service supported 34 women and 7 men,
across a range of ages.
There was a range of LD presentations, which were sometimes self-reported and other times reported by other agencies and services.
There was a mixture of formal and non-formal diagnoses. Some clients had multiple diagnoses.
Table 3 illustrates the types of disabilities and (suspected) diagnoses reported to the ISVA. Not all fit under the LD umbrella. However, the LD ISVA determined the type of LD and how it affected each individual client during meetings with them/their carers and through discussions with professionals.
Table 3: disability/diagnoses as reported to the LD ISVA
Autism   7
3
Attention deficit disorder 2
3
Illiteracy   2
2
Language / communication 2
  Disability/diagnosis
#
   Mild LD
10
         Global developmental delay
    Intellectual disability
     Moderate LD
   Severe LD
Autism (severe) Borderline LD Developmental delay Social and emotional LD
2
2
1
1
1
1
1
1
1
1
Figure 3: gender split
  ADHD
     Autistic traits
     Brain injury
     Dyslexia
    Undiagnosed LD
  1
 Table 4: client local authority
Although most clients came from the Bristol local authority (41.5%) a significant proportion came from BANES (17.1%) and Somerset (29.3%). Most clients (83%) were women.
Referral into LD ISVA #
     Bristol Somerset BANES N Somerset South Glos
41.5% 29.3%
17
    12
7
17.1% 7.3%
4.9%
 3
Asperger’s
 2
    10 | Safe Link
